|
FY2016 House 1 |
FY2016 House Final |
FY2016 Senate Final |
FY2016 GAA |
|
|---|---|---|---|---|
| Budget Tracking | 29,911,301 | 32,193,620 | 33,080,000 | 33,120,000 |
|
FY2013 GAA |
FY2014 GAA |
FY2015 GAA |
FY2015 Projected |
FY2016 GAA |
|
|---|---|---|---|---|---|
| Historical Budget Levels | 32,101,023 | 32,108,793 | 32,229,847 | 32,229,848 | 33,120,000 |
* GAA is General Appropriation Act.
| SPENDING CATEGORY |
FY2012 Expended |
FY2013 Expended |
FY2014 Expended |
FY2015 Projected |
FY2016 GAA |
|---|---|---|---|---|---|
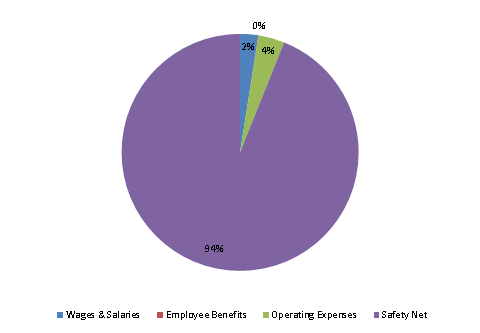
| Wages & Salaries | 999 | 809 | 698 | 770 | 817 |
| Employee Benefits | 14 | 9 | 9 | 11 | 12 |
| Operating Expenses | 1,296 | 1,412 | 1,129 | 1,221 | 1,182 |
| Safety Net | 29,388 | 29,404 | 29,492 | 30,228 | 31,110 |
| TOTAL | 31,697 | 31,633 | 31,328 | 32,230 | 33,120 |
FY2016 Spending Category Chart
