|
FY2016 House 1 |
FY2016 House Final |
FY2016 Senate Final |
FY2016 GAA |
|
|---|---|---|---|---|
| Budget Tracking | 794,775 | 1,195,993 | 1,095,901 | 1,195,901 |
|
FY2013 GAA |
FY2014 GAA |
FY2015 GAA |
FY2015 Projected |
FY2016 GAA |
|
|---|---|---|---|---|---|
| Historical Budget Levels | 1,067,287 | 969,933 | 1,737,593 | 1,308,448 | 1,195,901 |
* GAA is General Appropriation Act.
| SPENDING CATEGORY |
FY2012 Expended |
FY2013 Expended |
FY2014 Expended |
FY2015 Projected |
FY2016 GAA |
|---|---|---|---|---|---|
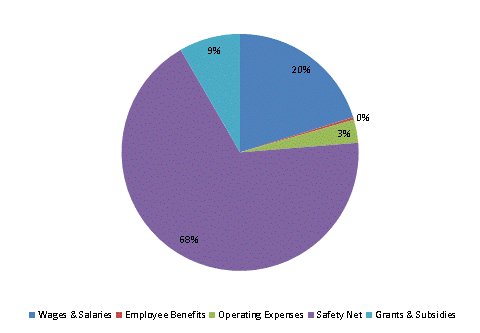
| Wages & Salaries | 148 | 401 | 399 | 234 | 241 |
| Employee Benefits | 3 | 2 | 2 | 4 | 4 |
| Operating Expenses | 37 | 38 | 37 | 38 | 38 |
| Safety Net | 775 | 625 | 525 | 883 | 812 |
| Grants & Subsidies | 0 | 0 | 0 | 150 | 100 |
| TOTAL | 963 | 1,066 | 964 | 1,308 | 1,196 |
FY2016 Spending Category Chart
