|
FY2016 House 1 |
FY2016 House Final |
FY2016 Senate Final |
FY2016 GAA |
|
|---|---|---|---|---|
| Budget Tracking | 893,149 | 891,286 | 893,149 | 891,286 |
|
FY2013 GAA |
FY2014 GAA |
FY2015 GAA |
FY2015 Projected |
FY2016 GAA |
|
|---|---|---|---|---|---|
| Historical Budget Levels | 889,889 | 889,889 | 891,286 | 891,287 | 891,286 |
* GAA is General Appropriation Act.
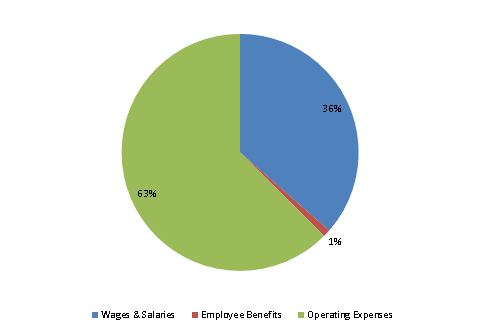
| SPENDING CATEGORY |
FY2012 Expended |
FY2013 Expended |
FY2014 Expended |
FY2015 Projected |
FY2016 GAA |
|---|---|---|---|---|---|
| Wages & Salaries | 204 | 254 | 193 | 319 | 325 |
| Employee Benefits | 4 | 3 | 2 | 9 | 9 |
| Operating Expenses | 42 | 34 | 43 | 564 | 558 |
| TOTAL | 250 | 291 | 239 | 891 | 891 |
FY2016 Spending Category Chart