|
FY2016 House 1 |
FY2016 House Final |
FY2016 Senate Final |
FY2016 GAA |
|
|---|---|---|---|---|
| Budget Tracking | 116,251,547 | 120,162,098 | 117,000,000 | 117,000,000 |
|
FY2013 GAA |
FY2014 GAA |
FY2015 GAA |
FY2015 Projected |
FY2016 GAA |
|
|---|---|---|---|---|---|
| Historical Budget Levels | 102,919,356 | 106,622,349 | 118,064,994 | 115,629,093 | 117,000,000 |
* GAA is General Appropriation Act.
| SPENDING CATEGORY |
FY2012 Expended |
FY2013 Expended |
FY2014 Expended |
FY2015 Projected |
FY2016 GAA |
|---|---|---|---|---|---|
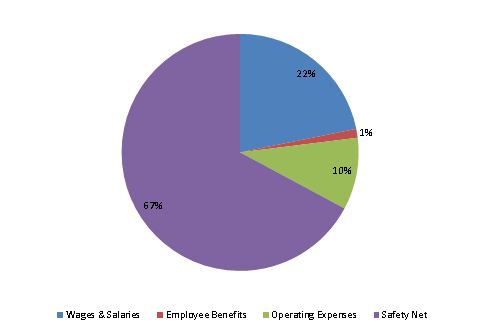
| Wages & Salaries | 20,612 | 21,886 | 22,832 | 24,802 | 25,536 |
| Employee Benefits | 1,859 | 1,931 | 1,817 | 1,395 | 1,398 |
| Operating Expenses | 8,326 | 9,024 | 12,005 | 11,466 | 11,500 |
| Safety Net | 65,417 | 67,493 | 70,749 | 77,966 | 78,566 |
| TOTAL | 96,213 | 100,334 | 107,404 | 115,629 | 117,000 |
FY2016 Spending Category Chart
