|
FY2016 House 1 |
FY2016 House Final |
FY2016 Senate Final |
FY2016 GAA |
|
|---|---|---|---|---|
| Budget Tracking | 26,687,833 | 26,687,833 | 27,187,833 | 27,187,833 |
|
FY2013 GAA |
FY2014 GAA |
FY2015 GAA |
FY2015 Projected |
FY2016 GAA |
|
|---|---|---|---|---|---|
| Historical Budget Levels | 20,983,713 | 21,637,087 | 25,966,365 | 25,966,365 | 27,187,833 |
* GAA is General Appropriation Act.
| SPENDING CATEGORY |
FY2012 Expended |
FY2013 Expended |
FY2014 Expended |
FY2015 Projected |
FY2016 GAA |
|---|---|---|---|---|---|
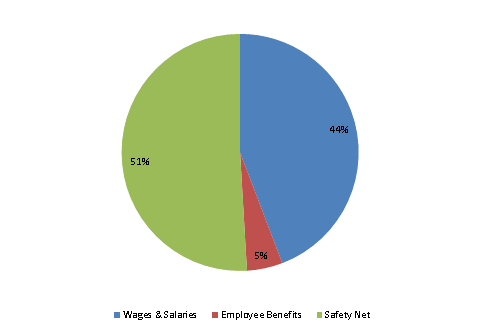
| Wages & Salaries | 9,248 | 9,661 | 10,554 | 11,252 | 12,019 |
| Employee Benefits | 460 | 804 | 890 | 1,289 | 1,322 |
| Operating Expenses | 7 | 0 | 2 | 0 | 0 |
| Safety Net | 7,753 | 9,934 | 11,362 | 13,425 | 13,847 |
| TOTAL | 17,467 | 20,400 | 22,808 | 25,966 | 27,188 |
FY2016 Spending Category Chart
