|
FY2016 House 1 |
FY2016 House Final |
FY2016 Senate Final |
FY2016 GAA |
|
|---|---|---|---|---|
| Budget Tracking | 4,434,660 | 4,438,360 | 4,434,660 | 4,434,660 |
|
FY2013 GAA |
FY2014 GAA |
FY2015 GAA |
FY2015 Projected |
FY2016 GAA |
|
|---|---|---|---|---|---|
| Historical Budget Levels | 4,049,575 | 4,082,818 | 4,179,008 | 4,179,009 | 4,434,660 |
* GAA is General Appropriation Act.
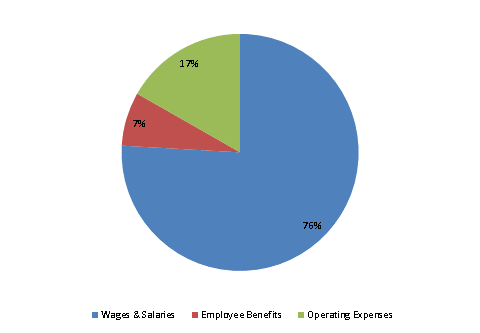
| SPENDING CATEGORY |
FY2012 Expended |
FY2013 Expended |
FY2014 Expended |
FY2015 Projected |
FY2016 GAA |
|---|---|---|---|---|---|
| Wages & Salaries | 2,798 | 2,809 | 2,845 | 3,140 | 3,366 |
| Employee Benefits | 318 | 399 | 370 | 322 | 325 |
| Operating Expenses | 854 | 643 | 687 | 717 | 743 |
| TOTAL | 3,970 | 3,852 | 3,902 | 4,179 | 4,435 |
FY2016 Spending Category Chart