|
FY2016 House 1 |
FY2016 House Final |
FY2016 Senate Final |
FY2016 GAA |
|
|---|---|---|---|---|
| Budget Tracking | 5,645,031 | 5,780,713 | 5,645,031 | 5,645,031 |
|
FY2013 GAA |
FY2014 GAA |
FY2015 GAA |
FY2015 Projected |
FY2016 GAA |
|
|---|---|---|---|---|---|
| Historical Budget Levels | 5,447,856 | 5,638,374 | 5,780,713 | 5,582,541 | 5,645,031 |
* GAA is General Appropriation Act.
| SPENDING CATEGORY |
FY2012 Expended |
FY2013 Expended |
FY2014 Expended |
FY2015 Projected |
FY2016 GAA |
|---|---|---|---|---|---|
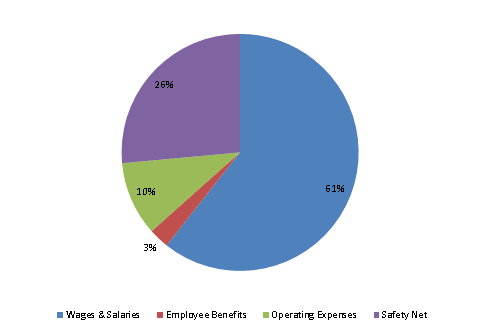
| Wages & Salaries | 3,011 | 3,076 | 3,149 | 3,340 | 3,424 |
| Employee Benefits | 153 | 140 | 140 | 148 | 156 |
| Operating Expenses | 546 | 574 | 618 | 572 | 572 |
| Safety Net | 1,400 | 1,545 | 1,604 | 1,523 | 1,493 |
| TOTAL | 5,110 | 5,334 | 5,512 | 5,583 | 5,645 |
FY2016 Spending Category Chart
