|
FY2016 House 1 |
FY2016 House Final |
FY2016 Senate Final |
FY2016 GAA |
|
|---|---|---|---|---|
| Budget Tracking | 8,777,574 | 14,472,488 | 9,512,574 | 9,512,574 |
|
FY2013 GAA |
FY2014 GAA |
FY2015 GAA |
FY2015 Projected |
FY2016 GAA |
|
|---|---|---|---|---|---|
| Historical Budget Levels | 12,679,279 | 8,731,421 | 8,832,510 | 8,225,815 | 9,512,574 |
* GAA is General Appropriation Act.
| SPENDING CATEGORY |
FY2012 Expended |
FY2013 Expended |
FY2014 Expended |
FY2015 Projected |
FY2016 GAA |
|---|---|---|---|---|---|
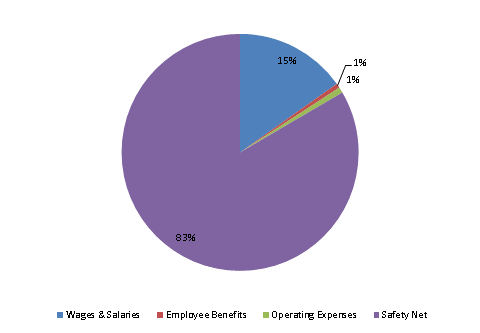
| Wages & Salaries | 1,210 | 1,260 | 1,251 | 1,382 | 1,445 |
| Employee Benefits | 50 | 42 | 49 | 56 | 57 |
| Operating Expenses | 115 | 77 | 72 | 74 | 74 |
| Safety Net | 10,637 | 10,992 | 6,765 | 6,713 | 7,936 |
| TOTAL | 12,012 | 12,371 | 8,136 | 8,226 | 9,513 |
FY2016 Spending Category Chart
