|
FY2016 House 1 |
FY2016 House Final |
FY2016 Senate Final |
FY2016 GAA |
|
|---|---|---|---|---|
| Budget Tracking | 3,007,613 | 3,340,735 | 3,307,613 | 3,340,735 |
|
FY2013 GAA |
FY2014 GAA |
FY2015 GAA |
FY2015 Projected |
FY2016 GAA |
|
|---|---|---|---|---|---|
| Historical Budget Levels | 3,053,118 | 3,353,118 | 3,353,118 | 3,277,821 | 3,340,735 |
* GAA is General Appropriation Act.
| SPENDING CATEGORY |
FY2012 Expended |
FY2013 Expended |
FY2014 Expended |
FY2015 Projected |
FY2016 GAA |
|---|---|---|---|---|---|
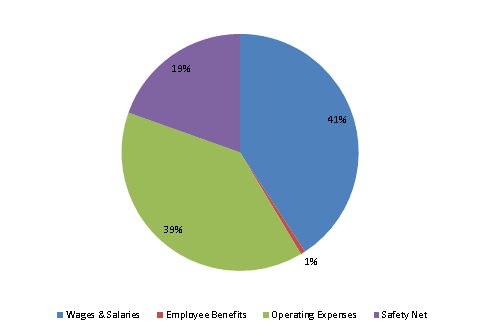
| Wages & Salaries | 73 | 329 | 1,330 | 1,419 | 1,362 |
| Employee Benefits | 1 | 4 | 19 | 23 | 22 |
| Operating Expenses | 1,429 | 1,291 | 1,310 | 1,308 | 1,304 |
| Safety Net | 1,329 | 1,281 | 559 | 529 | 653 |
| TOTAL | 2,833 | 2,906 | 3,219 | 3,278 | 3,341 |
FY2016 Spending Category Chart
