|
FY2016 House 1 |
FY2016 House Final |
FY2016 Senate Final |
FY2016 GAA |
|
|---|---|---|---|---|
| Budget Tracking | 4,204,928 | 4,196,305 | 4,196,305 | 4,196,305 |
|
FY2013 GAA |
FY2014 GAA |
FY2015 GAA |
FY2015 Projected |
FY2016 GAA |
|
|---|---|---|---|---|---|
| Historical Budget Levels | 3,954,067 | 4,022,805 | 4,070,352 | 4,115,755 | 4,196,305 |
* GAA is General Appropriation Act.
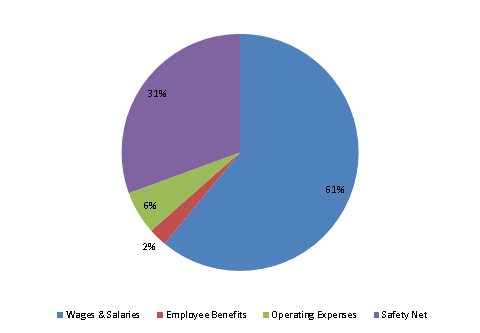
| SPENDING CATEGORY |
FY2012 Expended |
FY2013 Expended |
FY2014 Expended |
FY2015 Projected |
FY2016 GAA |
|---|---|---|---|---|---|
| Wages & Salaries | 2,161 | 2,262 | 2,358 | 2,472 | 2,560 |
| Employee Benefits | 110 | 108 | 106 | 112 | 105 |
| Operating Expenses | 274 | 246 | 245 | 249 | 249 |
| Safety Net | 1,240 | 1,211 | 1,200 | 1,283 | 1,283 |
| TOTAL | 3,785 | 3,828 | 3,909 | 4,116 | 4,196 |
FY2016 Spending Category Chart