|
FY2016 House 1 |
FY2016 House Final |
FY2016 Senate Final |
FY2016 GAA |
|
|---|---|---|---|---|
| Budget Tracking | 1,486,228 | 1,411,499 | 1,461,023 | 1,461,023 |
|
FY2013 GAA |
FY2014 GAA |
FY2015 GAA |
FY2015 Projected |
FY2016 GAA |
|
|---|---|---|---|---|---|
| Historical Budget Levels | 1,348,142 | 1,361,524 | 1,382,207 | 1,357,207 | 1,461,023 |
* GAA is General Appropriation Act.
| SPENDING CATEGORY |
FY2012 Expended |
FY2013 Expended |
FY2014 Expended |
FY2015 Projected |
FY2016 GAA |
|---|---|---|---|---|---|
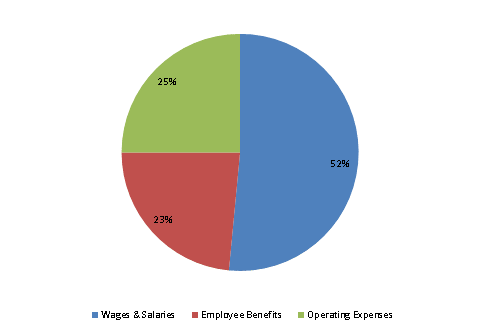
| Wages & Salaries | 538 | 646 | 659 | 666 | 753 |
| Employee Benefits | 8 | 370 | 361 | 342 | 343 |
| Operating Expenses | 413 | 321 | 323 | 348 | 366 |
| TOTAL | 959 | 1,337 | 1,343 | 1,357 | 1,461 |
FY2016 Spending Category Chart
