|
FY2016 House 1 |
FY2016 House Final |
FY2016 Senate Final |
FY2016 GAA |
|
|---|---|---|---|---|
| Budget Tracking | 17,464,890 | 21,314,890 | 19,464,890 | 21,314,890 |
|
FY2013 GAA |
FY2014 GAA |
FY2015 GAA |
FY2015 Projected |
FY2016 GAA |
|
|---|---|---|---|---|---|
| Historical Budget Levels | 18,164,890 | 18,164,890 | 18,464,890 | 17,464,890 | 21,314,890 |
* GAA is General Appropriation Act.
| SPENDING CATEGORY |
FY2012 Expended |
FY2013 Expended |
FY2014 Expended |
FY2015 Projected |
FY2016 GAA |
|---|---|---|---|---|---|
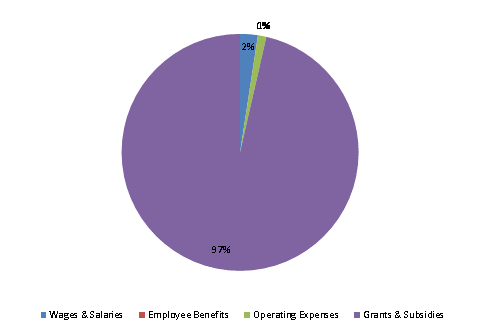
| Wages & Salaries | 230 | 348 | 438 | 462 | 511 |
| Employee Benefits | 3 | 3 | 4 | 5 | 6 |
| Operating Expenses | 363 | 209 | 242 | 220 | 244 |
| Grants & Subsidies | 17,596 | 17,353 | 17,403 | 16,778 | 20,555 |
| TOTAL | 18,191 | 17,913 | 18,087 | 17,465 | 21,315 |
FY2016 Spending Category Chart
