|
FY2016 House 1 |
FY2016 House Final |
FY2016 Senate Final |
FY2016 GAA |
|
|---|---|---|---|---|
| Budget Tracking | 252,944,993 | 252,944,993 | 252,944,993 | 252,944,993 |
|
FY2013 GAA |
FY2014 GAA |
FY2015 GAA |
FY2015 Projected |
FY2016 GAA |
|
|---|---|---|---|---|---|
| Historical Budget Levels | 231,870,452 | 214,340,742 | 241,894,678 | 236,271,503 | 252,944,993 |
* GAA is General Appropriation Act.
| SPENDING CATEGORY |
FY2012 Expended |
FY2013 Expended |
FY2014 Expended |
FY2015 Projected |
FY2016 GAA |
|---|---|---|---|---|---|
| Operating Expenses | 0 | 0 | 31 | 0 | 0 |
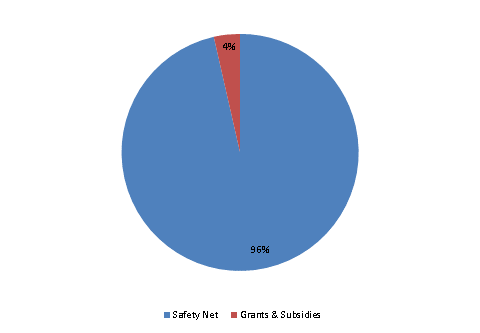
| Safety Net | 216,584 | 205,560 | 211,295 | 227,252 | 243,926 |
| Grants & Subsidies | 9,003 | 8,904 | 8,329 | 9,019 | 9,019 |
| TOTAL | 225,588 | 214,464 | 219,655 | 236,272 | 252,945 |
FY2016 Spending Category Chart
