|
FY2016 House 1 |
FY2016 House Final |
FY2016 Senate Final |
FY2016 GAA |
|
|---|---|---|---|---|
| Budget Tracking | 6,375,311 | 6,375,311 | 6,675,311 | 6,675,311 |
|
FY2013 GAA |
FY2014 GAA |
FY2015 GAA |
FY2015 Projected |
FY2016 GAA |
|
|---|---|---|---|---|---|
| Historical Budget Levels | 5,933,862 | 5,873,862 | 6,503,861 | 6,375,311 | 6,675,311 |
* GAA is General Appropriation Act.
| SPENDING CATEGORY |
FY2012 Expended |
FY2013 Expended |
FY2014 Expended |
FY2015 Projected |
FY2016 GAA |
|---|---|---|---|---|---|
| Wages & Salaries | 0 | 3 | 16 | 0 | 0 |
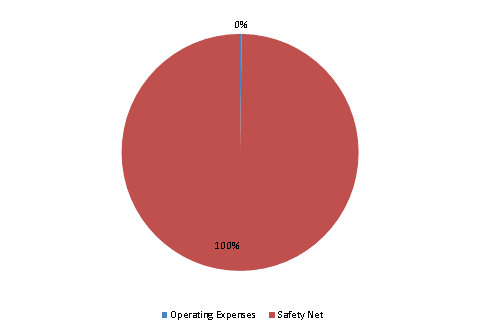
| Operating Expenses | 35 | 246 | 106 | 96 | 14 |
| Safety Net | 5,506 | 5,226 | 5,687 | 6,279 | 6,661 |
| Grants & Subsidies | 349 | 344 | 0 | 0 | 0 |
| TOTAL | 5,890 | 5,819 | 5,808 | 6,375 | 6,675 |
FY2016 Spending Category Chart
