|
FY2016 House 1 |
FY2016 House Final |
FY2016 Senate Final |
FY2016 GAA |
|
|---|---|---|---|---|
| Budget Tracking | 13,813,060 | 13,719,920 | 13,813,060 | 13,719,920 |
|
FY2013 GAA |
FY2014 GAA |
FY2015 GAA |
FY2015 Projected |
FY2016 GAA |
|
|---|---|---|---|---|---|
| Historical Budget Levels | 12,322,954 | 12,844,972 | 13,365,851 | 13,364,109 | 13,719,920 |
* GAA is General Appropriation Act.
| SPENDING CATEGORY |
FY2012 Expended |
FY2013 Expended |
FY2014 Expended |
FY2015 Projected |
FY2016 GAA |
|---|---|---|---|---|---|
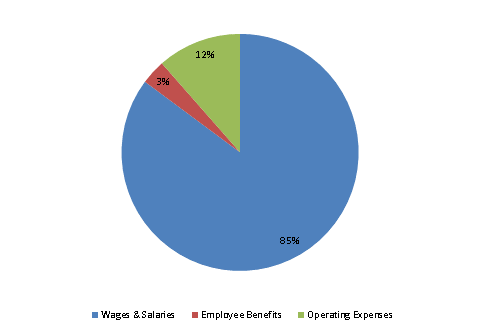
| Wages & Salaries | 9,522 | 9,924 | 10,622 | 11,253 | 11,684 |
| Employee Benefits | 446 | 397 | 488 | 509 | 460 |
| Operating Expenses | 1,531 | 1,609 | 1,684 | 1,602 | 1,576 |
| TOTAL | 11,498 | 11,930 | 12,793 | 13,364 | 13,720 |
FY2016 Spending Category Chart
