|
FY2016 House 1 |
FY2016 House Final |
FY2016 Senate Final |
FY2016 GAA |
|
|---|---|---|---|---|
| Budget Tracking | 5,896,618 | 6,387,596 | 5,722,419 | 6,387,596 |
|
FY2013 GAA |
FY2014 GAA |
FY2015 GAA |
FY2015 Projected |
FY2016 GAA |
|
|---|---|---|---|---|---|
| Historical Budget Levels | 4,812,837 | 5,509,039 | 6,037,213 | 5,698,050 | 6,387,596 |
* GAA is General Appropriation Act.
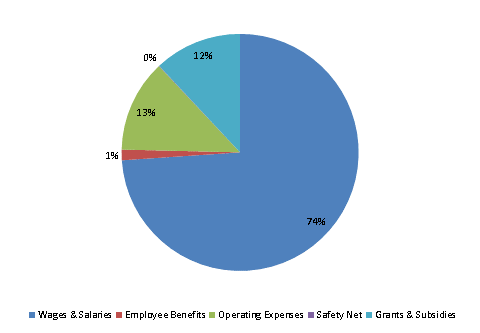
| SPENDING CATEGORY |
FY2012 Expended |
FY2013 Expended |
FY2014 Expended |
FY2015 Projected |
FY2016 GAA |
|---|---|---|---|---|---|
| Wages & Salaries | 3,714 | 3,969 | 4,142 | 4,420 | 4,722 |
| Employee Benefits | 79 | 58 | 66 | 81 | 92 |
| Operating Expenses | 555 | 543 | 839 | 747 | 805 |
| Safety Net | 2 | 0 | 2 | 4 | 4 |
| Grants & Subsidies | 0 | 100 | 672 | 445 | 764 |
| TOTAL | 4,349 | 4,670 | 5,720 | 5,698 | 6,388 |
FY2016 Spending Category Chart