|
FY2016 House 1 |
FY2016 House Final |
FY2016 Senate Final |
FY2016 GAA |
|
|---|---|---|---|---|
| Budget Tracking | 27,946,811 | 29,498,619 | 29,520,620 | 29,520,620 |
|
FY2013 GAA |
FY2014 GAA |
FY2015 GAA |
FY2015 Projected |
FY2016 GAA |
|
|---|---|---|---|---|---|
| Historical Budget Levels | 25,966,270 | 28,354,269 | 29,003,667 | 29,038,198 | 29,520,620 |
* GAA is General Appropriation Act.
| SPENDING CATEGORY |
FY2012 Expended |
FY2013 Expended |
FY2014 Expended |
FY2015 Projected |
FY2016 GAA |
|---|---|---|---|---|---|
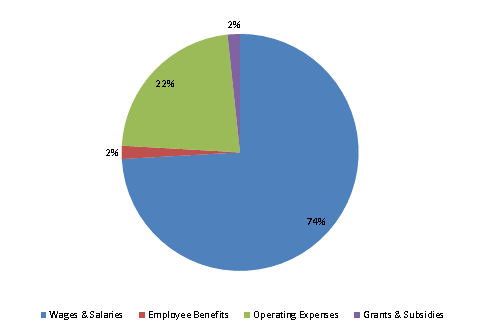
| Wages & Salaries | 18,824 | 19,538 | 20,569 | 21,311 | 21,878 |
| Employee Benefits | 449 | 345 | 507 | 489 | 529 |
| Operating Expenses | 5,297 | 5,568 | 5,669 | 7,238 | 6,614 |
| Grants & Subsidies | 0 | 0 | 482 | 0 | 500 |
| TOTAL | 24,570 | 25,450 | 27,227 | 29,038 | 29,521 |
FY2016 Spending Category Chart
