|
FY2016 House 1 |
FY2016 House Final |
FY2016 Senate Final |
FY2016 GAA |
|
|---|---|---|---|---|
| Budget Tracking | 3,389,267 | 3,522,497 | 3,474,287 | 3,522,497 |
|
FY2013 GAA |
FY2014 GAA |
FY2015 GAA |
FY2015 Projected |
FY2016 GAA |
|
|---|---|---|---|---|---|
| Historical Budget Levels | 2,695,839 | 3,301,487 | 3,051,269 | 3,713,282 | 3,522,497 |
* GAA is General Appropriation Act.
| SPENDING CATEGORY |
FY2012 Expended |
FY2013 Expended |
FY2014 Expended |
FY2015 Projected |
FY2016 GAA |
|---|---|---|---|---|---|
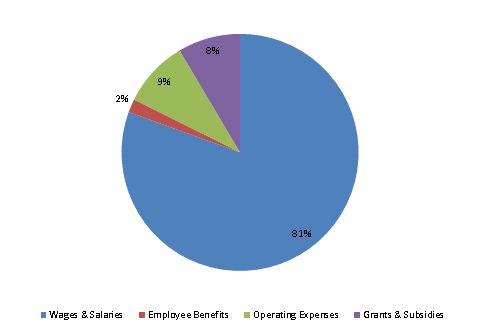
| Wages & Salaries | 1,954 | 1,980 | 2,073 | 2,233 | 2,837 |
| Employee Benefits | 47 | 38 | 44 | 49 | 64 |
| Operating Expenses | 288 | 359 | 324 | 819 | 321 |
| Grants & Subsidies | 75 | 238 | 467 | 612 | 300 |
| TOTAL | 2,364 | 2,614 | 2,908 | 3,713 | 3,522 |
FY2016 Spending Category Chart
