|
FY2016 House 1 |
FY2016 House Final |
FY2016 Senate Final |
FY2016 GAA |
|
|---|---|---|---|---|
| Budget Tracking | 27,938,953 | 27,938,953 | 27,938,953 | 27,938,953 |
|
FY2013 GAA |
FY2014 GAA |
FY2015 GAA |
FY2015 Projected |
FY2016 GAA |
|
|---|---|---|---|---|---|
| Historical Budget Levels | 27,940,257 | 27,938,953 | 27,938,953 | 27,938,953 | 27,938,953 |
* GAA is General Appropriation Act.
| SPENDING CATEGORY |
FY2012 Expended |
FY2013 Expended |
FY2014 Expended |
FY2015 Projected |
FY2016 GAA |
|---|---|---|---|---|---|
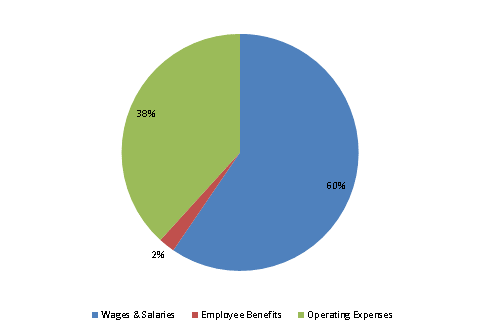
| Wages & Salaries | 15,195 | 16,215 | 15,880 | 16,504 | 16,632 |
| Employee Benefits | 540 | 516 | 442 | 481 | 619 |
| Operating Expenses | 8,147 | 9,610 | 11,300 | 10,954 | 10,689 |
| TOTAL | 23,882 | 26,341 | 27,621 | 27,939 | 27,939 |
FY2016 Spending Category Chart
