|
FY2016 House 1 |
FY2016 House Final |
FY2016 Senate Final |
FY2016 GAA |
|
|---|---|---|---|---|
| Budget Tracking | 88,872,929 | 92,872,929 | 102,261,227 | 94,872,929 |
|
FY2013 GAA |
FY2014 GAA |
FY2015 GAA |
FY2015 Projected |
FY2016 GAA |
|
|---|---|---|---|---|---|
| Historical Budget Levels | 87,225,100 | 89,668,584 | 94,179,565 | 89,591,085 | 94,872,929 |
* GAA is General Appropriation Act.
| SPENDING CATEGORY |
FY2012 Expended |
FY2013 Expended |
FY2014 Expended |
FY2015 Projected |
FY2016 GAA |
|---|---|---|---|---|---|
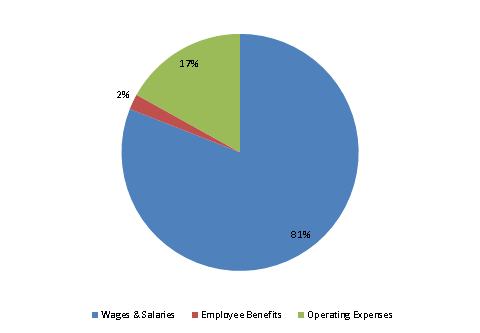
| Wages & Salaries | 66,248 | 68,972 | 72,616 | 71,359 | 76,809 |
| Employee Benefits | 2,123 | 1,717 | 1,803 | 1,921 | 2,000 |
| Operating Expenses | 12,010 | 15,088 | 15,092 | 16,311 | 16,063 |
| TOTAL | 80,380 | 85,777 | 89,512 | 89,591 | 94,873 |
FY2016 Spending Category Chart
