|
FY2016 House 1 |
FY2016 House Final |
FY2016 Senate Final |
FY2016 GAA |
|
|---|---|---|---|---|
| Budget Tracking | 2,239,436 | 2,239,436 | 2,239,436 | 2,239,436 |
|
FY2013 GAA |
FY2014 GAA |
FY2015 GAA |
FY2015 Projected |
FY2016 GAA |
|
|---|---|---|---|---|---|
| Historical Budget Levels | 2,017,862 | 2,500,000 | 2,072,548 | 2,072,549 | 2,239,436 |
* GAA is General Appropriation Act.
| SPENDING CATEGORY |
FY2012 Expended |
FY2013 Expended |
FY2014 Expended |
FY2015 Projected |
FY2016 GAA |
|---|---|---|---|---|---|
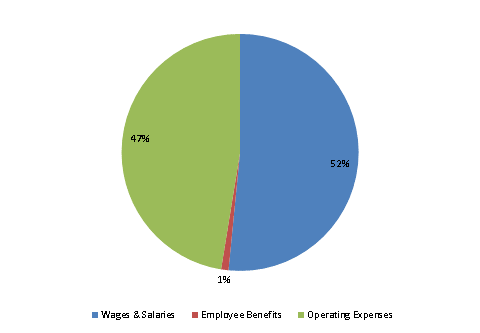
| Wages & Salaries | 959 | 1,120 | 880 | 1,422 | 1,155 |
| Employee Benefits | 314 | 89 | 223 | 27 | 22 |
| Operating Expenses | 539 | 783 | 805 | 623 | 1,062 |
| TOTAL | 1,812 | 1,992 | 1,909 | 2,073 | 2,239 |
FY2016 Spending Category Chart
