|
FY2016 House 1 |
FY2016 House Final |
FY2016 Senate Final |
FY2016 GAA |
|
|---|---|---|---|---|
| Budget Tracking | 1,596,665,738 | 1,626,025,173 | 1,626,025,173 | 1,626,025,173 |
|
FY2013 GAA |
FY2014 GAA |
FY2015 GAA |
FY2015 Projected |
FY2016 GAA |
|
|---|---|---|---|---|---|
| Historical Budget Levels | 1,223,126,679 | 1,272,894,957 | 1,391,500,896 | 1,581,500,896 | 1,626,025,173 |
* GAA is General Appropriation Act.
| SPENDING CATEGORY |
FY2012 Expended |
FY2013 Expended |
FY2014 Expended |
FY2015 Projected |
FY2016 GAA |
|---|---|---|---|---|---|
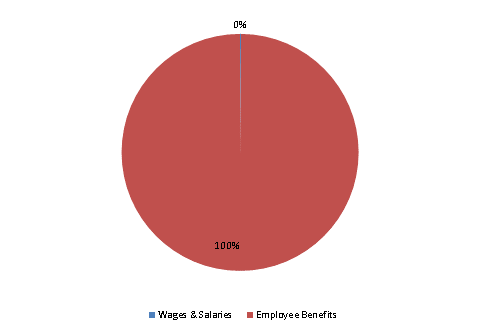
| Wages & Salaries | 1,680 | 1,905 | 2,206 | 2,667 | 2,167 |
| Employee Benefits | 1,122,209 | 1,214,490 | 1,336,488 | 1,578,834 | 1,623,858 |
| TOTAL | 1,123,889 | 1,216,395 | 1,338,693 | 1,581,501 | 1,626,025 |
FY2016 Spending Category Chart
