|
FY2016 House 1 |
FY2016 House Final |
FY2016 Senate Final |
FY2016 GAA |
|
|---|---|---|---|---|
| Budget Tracking | 4,732,711 | 4,519,647 | 4,507,614 | 4,507,614 |
|
FY2013 GAA |
FY2014 GAA |
FY2015 GAA |
FY2015 Projected |
FY2016 GAA |
|
|---|---|---|---|---|---|
| Historical Budget Levels | 2,337,203 | 4,062,182 | 4,275,709 | 3,808,165 | 4,507,614 |
* GAA is General Appropriation Act.
| SPENDING CATEGORY |
FY2012 Expended |
FY2013 Expended |
FY2014 Expended |
FY2015 Projected |
FY2016 GAA |
|---|---|---|---|---|---|
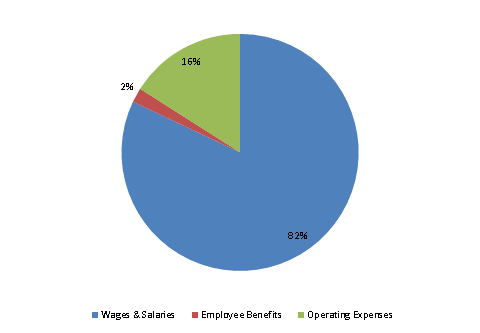
| Wages & Salaries | 2,159 | 2,071 | 3,210 | 3,142 | 3,698 |
| Employee Benefits | 44 | 29 | 42 | 87 | 89 |
| Operating Expenses | 288 | 55 | 446 | 580 | 721 |
| TOTAL | 2,491 | 2,155 | 3,698 | 3,808 | 4,508 |
FY2016 Spending Category Chart
