|
FY2016 House 1 |
FY2016 House Final |
FY2016 Senate Final |
FY2016 GAA |
|
|---|---|---|---|---|
| Budget Tracking | 2,725,124 | 2,774,793 | 2,943,391 | 2,943,391 |
|
FY2013 GAA |
FY2014 GAA |
FY2015 GAA |
FY2015 Projected |
FY2016 GAA |
|
|---|---|---|---|---|---|
| Historical Budget Levels | 2,316,927 | 2,412,668 | 2,774,793 | 2,725,124 | 2,943,391 |
* GAA is General Appropriation Act.
| SPENDING CATEGORY |
FY2012 Expended |
FY2013 Expended |
FY2014 Expended |
FY2015 Projected |
FY2016 GAA |
|---|---|---|---|---|---|
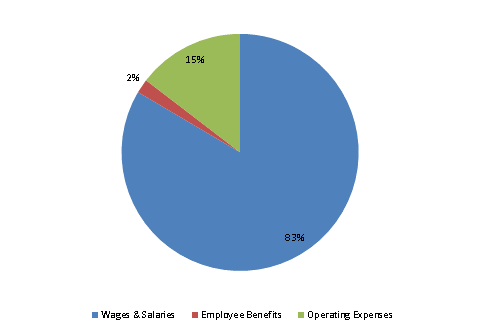
| Wages & Salaries | 1,825 | 1,930 | 2,038 | 2,297 | 2,457 |
| Employee Benefits | 48 | 37 | 39 | 53 | 56 |
| Operating Expenses | 336 | 314 | 335 | 376 | 430 |
| TOTAL | 2,210 | 2,281 | 2,412 | 2,725 | 2,943 |
FY2016 Spending Category Chart
