|
FY2016 House 1 |
FY2016 House Final |
FY2016 Senate Final |
FY2016 GAA |
|
|---|---|---|---|---|
| Budget Tracking | 11,205,654 | 11,117,966 | 11,205,654 | 11,117,966 |
|
FY2013 GAA |
FY2014 GAA |
FY2015 GAA |
FY2015 Projected |
FY2016 GAA |
|
|---|---|---|---|---|---|
| Historical Budget Levels | 10,453,359 | 10,289,943 | 13,689,943 | 11,117,966 | 11,117,966 |
* GAA is General Appropriation Act.
| SPENDING CATEGORY |
FY2012 Expended |
FY2013 Expended |
FY2014 Expended |
FY2015 Projected |
FY2016 GAA |
|---|---|---|---|---|---|
| Wages & Salaries | 0 | 1,243 | 1,269 | 2,052 | 1,658 |
| Employee Benefits | 0 | 25 | 19 | 52 | 42 |
| Operating Expenses | 0 | 8,135 | 8,159 | 9,014 | 9,418 |
| TOTAL | 0 | 9,403 | 9,447 | 11,118 | 11,118 |
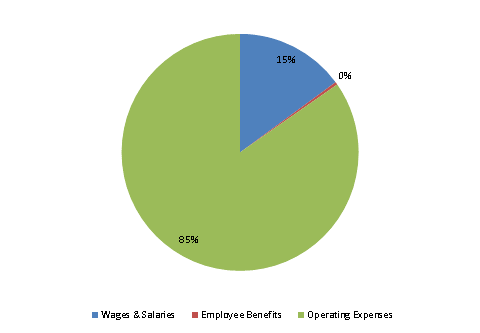
FY2016 Spending Category Chart