|
FY2016 House 1 |
FY2016 House Final |
FY2016 Senate Final |
FY2016 GAA |
|
|---|---|---|---|---|
| Budget Tracking | 32,359,861 | 32,359,861 | 32,359,861 | 32,359,861 |
|
FY2013 GAA |
FY2014 GAA |
FY2015 GAA |
FY2015 Projected |
FY2016 GAA |
|
|---|---|---|---|---|---|
| Historical Budget Levels | 24,813,326 | 28,388,558 | 34,891,260 | 32,044,978 | 32,359,861 |
* GAA is General Appropriation Act.
| SPENDING CATEGORY |
FY2012 Expended |
FY2013 Expended |
FY2014 Expended |
FY2015 Projected |
FY2016 GAA |
|---|---|---|---|---|---|
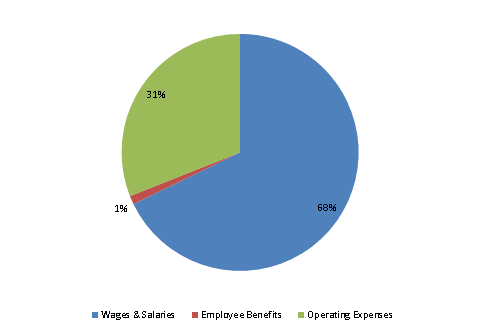
| Wages & Salaries | 21,466 | 21,883 | 22,491 | 23,636 | 21,942 |
| Employee Benefits | 428 | 292 | 329 | 400 | 378 |
| Operating Expenses | 4,564 | 5,715 | 8,558 | 8,008 | 10,040 |
| TOTAL | 26,458 | 27,890 | 31,379 | 32,045 | 32,360 |
FY2016 Spending Category Chart
