|
FY2016 House 1 |
FY2016 House Final |
FY2016 Senate Final |
FY2016 GAA |
|
|---|---|---|---|---|
| Budget Tracking | 8,853,050 | 9,472,541 | 9,014,337 | 9,014,337 |
|
FY2013 GAA |
FY2014 GAA |
FY2015 GAA |
FY2015 Projected |
FY2016 GAA |
|
|---|---|---|---|---|---|
| Historical Budget Levels | 8,297,378 | 8,543,692 | 9,014,337 | 8,852,980 | 9,014,337 |
* GAA is General Appropriation Act.
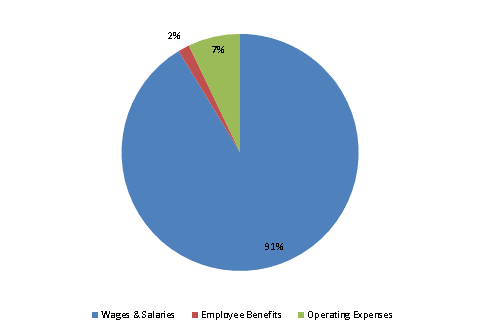
| SPENDING CATEGORY |
FY2012 Expended |
FY2013 Expended |
FY2014 Expended |
FY2015 Projected |
FY2016 GAA |
|---|---|---|---|---|---|
| Wages & Salaries | 7,410 | 7,624 | 7,912 | 8,260 | 8,232 |
| Employee Benefits | 127 | 100 | 111 | 135 | 140 |
| Operating Expenses | 247 | 483 | 520 | 458 | 642 |
| TOTAL | 7,784 | 8,207 | 8,544 | 8,853 | 9,014 |
FY2016 Spending Category Chart