|
FY2016 House 1 |
FY2016 House Final |
FY2016 Senate Final |
FY2016 GAA |
|
|---|---|---|---|---|
| Budget Tracking | 2,118,911 | 2,168,911 | 2,118,911 | 2,168,911 |
|
FY2013 GAA |
FY2014 GAA |
FY2015 GAA |
FY2015 Projected |
FY2016 GAA |
|
|---|---|---|---|---|---|
| Historical Budget Levels | 2,118,911 | 2,118,911 | 2,118,911 | 2,118,911 | 2,168,911 |
* GAA is General Appropriation Act.
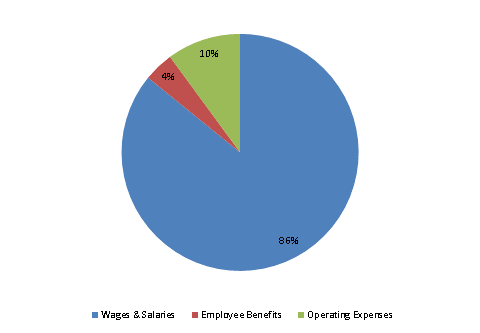
| SPENDING CATEGORY |
FY2012 Expended |
FY2013 Expended |
FY2014 Expended |
FY2015 Projected |
FY2016 GAA |
|---|---|---|---|---|---|
| Wages & Salaries | 1,698 | 1,711 | 1,775 | 1,804 | 1,862 |
| Employee Benefits | 73 | 69 | 80 | 84 | 89 |
| Operating Expenses | 258 | 278 | 262 | 231 | 218 |
| Safety Net | 1 | 18 | 2 | 0 | 0 |
| TOTAL | 2,030 | 2,077 | 2,118 | 2,119 | 2,169 |
FY2016 Spending Category Chart