|
FY2016 House 1 |
FY2016 House Final |
FY2016 Senate Final |
FY2016 GAA |
|
|---|---|---|---|---|
| Budget Tracking | 1,459,594 | 1,536,196 | 1,536,196 | 1,536,196 |
|
FY2013 GAA |
FY2014 GAA |
FY2015 GAA |
FY2015 Projected |
FY2016 GAA |
|
|---|---|---|---|---|---|
| Historical Budget Levels | 1,295,342 | 1,408,036 | 1,486,196 | 1,459,594 | 1,536,196 |
* GAA is General Appropriation Act.
| SPENDING CATEGORY |
FY2012 Expended |
FY2013 Expended |
FY2014 Expended |
FY2015 Projected |
FY2016 GAA |
|---|---|---|---|---|---|
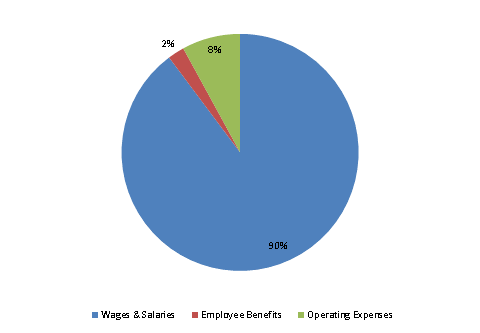
| Wages & Salaries | 1,045 | 1,099 | 1,192 | 1,321 | 1,379 |
| Employee Benefits | 34 | 27 | 34 | 42 | 35 |
| Operating Expenses | 117 | 113 | 143 | 97 | 122 |
| TOTAL | 1,196 | 1,239 | 1,369 | 1,460 | 1,536 |
FY2016 Spending Category Chart
