|
FY2016 House 1 |
FY2016 House Final |
FY2016 Senate Final |
FY2016 GAA |
|
|---|---|---|---|---|
| Budget Tracking | 2,483,519 | 2,578,783 | 2,486,413 | 2,578,782 |
|
FY2013 GAA |
FY2014 GAA |
FY2015 GAA |
FY2015 Projected |
FY2016 GAA |
|
|---|---|---|---|---|---|
| Historical Budget Levels | 2,263,052 | 2,307,496 | 2,528,783 | 2,483,519 | 2,578,782 |
* GAA is General Appropriation Act.
| SPENDING CATEGORY |
FY2012 Expended |
FY2013 Expended |
FY2014 Expended |
FY2015 Projected |
FY2016 GAA |
|---|---|---|---|---|---|
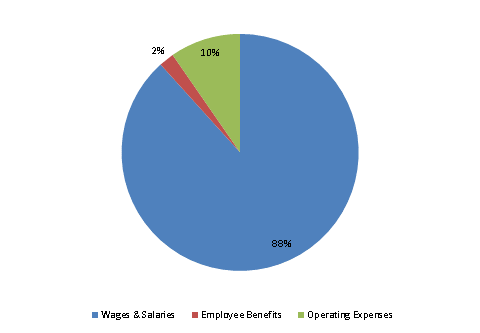
| Wages & Salaries | 2,062 | 2,129 | 2,081 | 2,207 | 2,277 |
| Employee Benefits | 59 | 44 | 41 | 51 | 53 |
| Operating Expenses | 191 | 314 | 585 | 225 | 248 |
| TOTAL | 2,313 | 2,488 | 2,707 | 2,484 | 2,579 |
FY2016 Spending Category Chart
