|
FY2016 House 1 |
FY2016 House Final |
FY2016 Senate Final |
FY2016 GAA |
|
|---|---|---|---|---|
| Budget Tracking | 1,473,854 | 1,500,717 | 1,473,854 | 1,473,854 |
|
FY2013 GAA |
FY2014 GAA |
FY2015 GAA |
FY2015 Projected |
FY2016 GAA |
|
|---|---|---|---|---|---|
| Historical Budget Levels | 1,502,039 | 1,500,717 | 1,500,717 | 1,460,717 | 1,473,854 |
* GAA is General Appropriation Act.
| SPENDING CATEGORY |
FY2012 Expended |
FY2013 Expended |
FY2014 Expended |
FY2015 Projected |
FY2016 GAA |
|---|---|---|---|---|---|
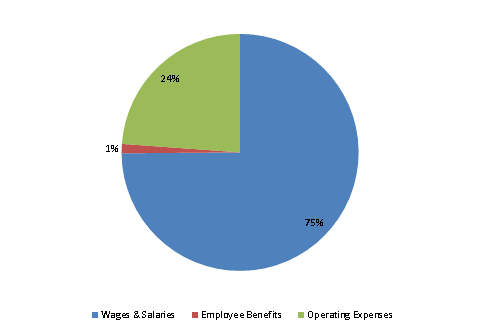
| Wages & Salaries | 1,169 | 1,112 | 1,055 | 1,115 | 1,104 |
| Employee Benefits | 25 | 15 | 18 | 22 | 19 |
| Operating Expenses | 300 | 316 | 333 | 324 | 352 |
| TOTAL | 1,494 | 1,443 | 1,407 | 1,461 | 1,474 |
FY2016 Spending Category Chart
