|
FY2016 House 1 |
FY2016 House Final |
FY2016 Senate Final |
FY2016 GAA |
|
|---|---|---|---|---|
| Budget Tracking | 3,694,142 | 3,694,142 | 3,757,371 | 3,757,371 |
|
FY2013 GAA |
FY2014 GAA |
FY2015 GAA |
FY2015 Projected |
FY2016 GAA |
|
|---|---|---|---|---|---|
| Historical Budget Levels | 3,333,588 | 3,532,371 | 3,532,371 | 3,492,371 | 3,757,371 |
* GAA is General Appropriation Act.
| SPENDING CATEGORY |
FY2012 Expended |
FY2013 Expended |
FY2014 Expended |
FY2015 Projected |
FY2016 GAA |
|---|---|---|---|---|---|
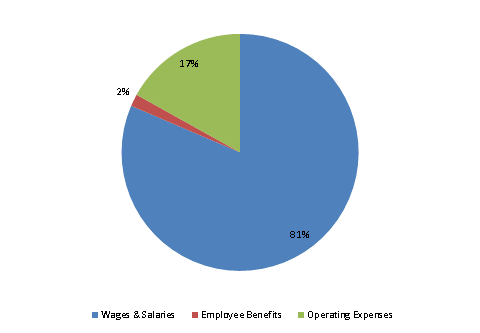
| Wages & Salaries | 2,275 | 2,586 | 2,768 | 2,856 | 3,060 |
| Employee Benefits | 56 | 54 | 55 | 60 | 62 |
| Operating Expenses | 560 | 588 | 552 | 577 | 636 |
| TOTAL | 2,892 | 3,227 | 3,375 | 3,492 | 3,757 |
FY2016 Spending Category Chart
