|
FY2016 House 1 |
FY2016 House Final |
FY2016 Senate Final |
FY2016 GAA |
|
|---|---|---|---|---|
| Budget Tracking | 2,500,000 | 2,500,000 | 2,500,000 | 2,500,000 |
|
FY2013 GAA |
FY2014 GAA |
FY2015 GAA |
FY2015 Projected |
FY2016 GAA |
|
|---|---|---|---|---|---|
| Historical Budget Levels | 775,000 | 2,000,000 | 2,000,000 | 2,000,000 | 2,500,000 |
* GAA is General Appropriation Act.
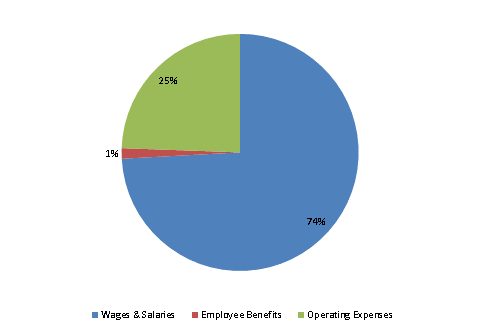
| SPENDING CATEGORY |
FY2012 Expended |
FY2013 Expended |
FY2014 Expended |
FY2015 Projected |
FY2016 GAA |
|---|---|---|---|---|---|
| Wages & Salaries | 665 | 689 | 1,436 | 1,854 | 1,854 |
| Employee Benefits | 15 | 12 | 30 | 36 | 36 |
| Operating Expenses | 75 | 63 | 264 | 111 | 611 |
| TOTAL | 756 | 764 | 1,731 | 2,000 | 2,500 |
FY2016 Spending Category Chart