|
FY2016 House 1 |
FY2016 House Final |
FY2016 Senate Final |
FY2016 GAA |
|
|---|---|---|---|---|
| Budget Tracking | 13,975,808 | 14,230,535 | 14,230,535 | 14,230,535 |
|
FY2013 GAA |
FY2014 GAA |
FY2015 GAA |
FY2015 Projected |
FY2016 GAA |
|
|---|---|---|---|---|---|
| Historical Budget Levels | 13,659,122 | 13,787,181 | 14,230,535 | 13,975,808 | 14,230,535 |
* GAA is General Appropriation Act.
| SPENDING CATEGORY |
FY2012 Expended |
FY2013 Expended |
FY2014 Expended |
FY2015 Projected |
FY2016 GAA |
|---|---|---|---|---|---|
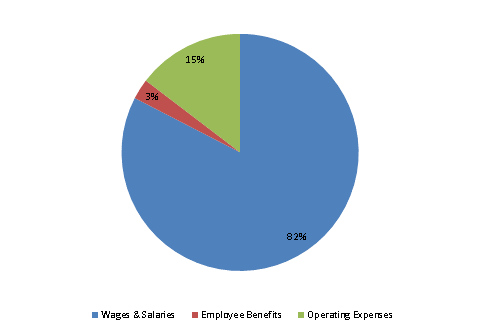
| Wages & Salaries | 10,651 | 11,492 | 11,136 | 11,723 | 11,751 |
| Employee Benefits | 398 | 361 | 379 | 421 | 397 |
| Operating Expenses | 2,914 | 2,233 | 2,223 | 1,832 | 2,083 |
| TOTAL | 13,963 | 14,086 | 13,738 | 13,976 | 14,231 |
FY2016 Spending Category Chart
