|
FY2016 House 1 |
FY2016 House Final |
FY2016 Senate Final |
FY2016 GAA |
|
|---|---|---|---|---|
| Budget Tracking | 18,181,484 | 18,181,484 | 18,181,484 | 18,181,484 |
|
FY2013 GAA |
FY2014 GAA |
FY2015 GAA |
FY2015 Projected |
FY2016 GAA |
|
|---|---|---|---|---|---|
| Historical Budget Levels | 29,131,247 | 30,465,601 | 23,304,673 | 9,292,657 | 18,181,484 |
* GAA is General Appropriation Act.
| SPENDING CATEGORY |
FY2012 Expended |
FY2013 Expended |
FY2014 Expended |
FY2015 Projected |
FY2016 GAA |
|---|---|---|---|---|---|
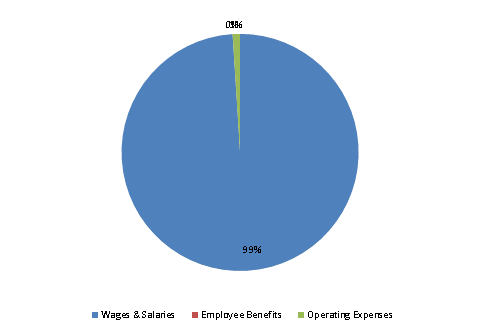
| Wages & Salaries | 0 | 264 | 347 | 326 | 17,998 |
| Employee Benefits | 0 | 5 | 8 | 4 | 1 |
| Operating Expenses | 160 | 155 | 489 | 0 | 182 |
| Debt Service | 12,119 | 11,158 | 9,525 | 8,963 | 0 |
| TOTAL | 12,279 | 11,582 | 10,369 | 9,293 | 18,181 |
FY2016 Spending Category Chart
