|
FY2016 House 1 |
FY2016 House Final |
FY2016 Senate Final |
FY2016 GAA |
|
|---|---|---|---|---|
| Budget Tracking | 2,193,347 | 2,233,096 | 2,233,096 | 2,233,096 |
|
FY2013 GAA |
FY2014 GAA |
FY2015 GAA |
FY2015 Projected |
FY2016 GAA |
|
|---|---|---|---|---|---|
| Historical Budget Levels | 2,161,481 | 2,161,481 | 2,233,096 | 2,223,096 | 2,233,096 |
* GAA is General Appropriation Act.
| SPENDING CATEGORY |
FY2012 Expended |
FY2013 Expended |
FY2014 Expended |
FY2015 Projected |
FY2016 GAA |
|---|---|---|---|---|---|
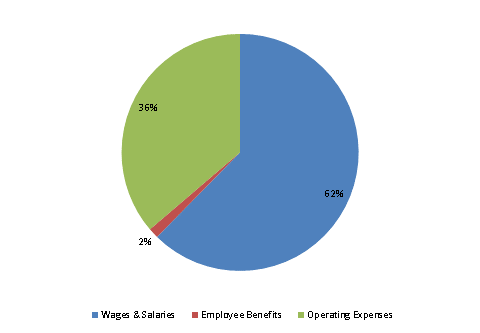
| Wages & Salaries | 1,395 | 1,495 | 1,428 | 1,441 | 1,393 |
| Employee Benefits | 31 | 25 | 25 | 48 | 31 |
| Operating Expenses | 765 | 631 | 699 | 734 | 809 |
| TOTAL | 2,192 | 2,150 | 2,151 | 2,223 | 2,233 |
FY2016 Spending Category Chart
