|
FY2016 House 1 |
FY2016 House Final |
FY2016 Senate Final |
FY2016 GAA |
|
|---|---|---|---|---|
| Budget Tracking | 5,700,000 | 7,140,540 | 7,200,000 | 7,200,000 |
|
FY2013 GAA |
FY2014 GAA |
FY2015 GAA |
FY2015 Projected |
FY2016 GAA |
|
|---|---|---|---|---|---|
| Historical Budget Levels | 8,646,892 | 5,380,914 | 9,881,600 | 9,968,046 | 7,200,000 |
* GAA is General Appropriation Act.
| SPENDING CATEGORY |
FY2012 Expended |
FY2013 Expended |
FY2014 Expended |
FY2015 Projected |
FY2016 GAA |
|---|---|---|---|---|---|
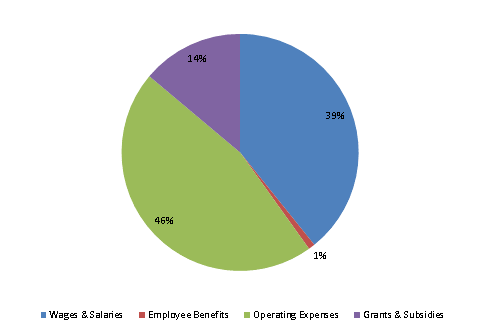
| Wages & Salaries | 1,895 | 2,834 | 2,762 | 2,849 | 2,824 |
| Employee Benefits | 66 | 43 | 49 | 61 | 64 |
| Operating Expenses | 2,772 | 6,618 | 3,039 | 4,986 | 3,312 |
| Grants & Subsidies | 1,022 | 1,742 | 7,684 | 2,072 | 1,000 |
| TOTAL | 5,754 | 11,237 | 13,534 | 9,968 | 7,200 |
FY2016 Spending Category Chart
