|
FY2016 House 1 |
FY2016 House Final |
FY2016 Senate Final |
FY2016 GAA |
|
|---|---|---|---|---|
| Budget Tracking | 6,103,930 | 6,214,549 | 6,383,101 | 6,383,101 |
|
FY2013 GAA |
FY2014 GAA |
FY2015 GAA |
FY2015 Projected |
FY2016 GAA |
|
|---|---|---|---|---|---|
| Historical Budget Levels | 5,912,424 | 5,970,365 | 6,214,549 | 6,214,549 | 6,383,101 |
* GAA is General Appropriation Act.
| SPENDING CATEGORY |
FY2012 Expended |
FY2013 Expended |
FY2014 Expended |
FY2015 Projected |
FY2016 GAA |
|---|---|---|---|---|---|
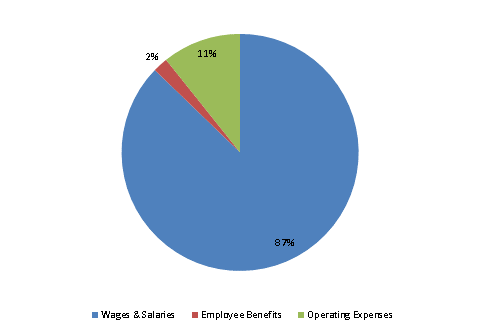
| Wages & Salaries | 5,327 | 5,003 | 5,117 | 5,239 | 5,568 |
| Employee Benefits | 139 | 100 | 118 | 133 | 131 |
| Operating Expenses | 427 | 705 | 689 | 843 | 685 |
| Grants & Subsidies | 0 | 58 | 5 | 0 | 0 |
| TOTAL | 5,893 | 5,865 | 5,930 | 6,215 | 6,383 |
FY2016 Spending Category Chart
