|
FY2016 House 1 |
FY2016 House Final |
FY2016 Senate Final |
FY2016 GAA |
|
|---|---|---|---|---|
| Budget Tracking | 1,815,806 | 1,941,692 | 1,941,692 | 1,941,692 |
|
FY2013 GAA |
FY2014 GAA |
FY2015 GAA |
FY2015 Projected |
FY2016 GAA |
|
|---|---|---|---|---|---|
| Historical Budget Levels | 1,660,006 | 1,860,006 | 2,115,806 | 2,077,933 | 1,941,692 |
* GAA is General Appropriation Act.
| SPENDING CATEGORY |
FY2012 Expended |
FY2013 Expended |
FY2014 Expended |
FY2015 Projected |
FY2016 GAA |
|---|---|---|---|---|---|
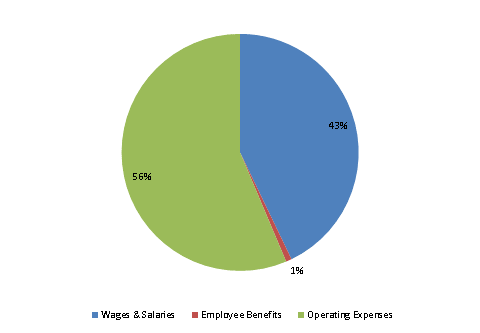
| Wages & Salaries | 591 | 590 | 627 | 685 | 832 |
| Employee Benefits | 15 | 11 | 12 | 14 | 15 |
| Operating Expenses | 1,054 | 1,059 | 1,217 | 1,379 | 1,094 |
| TOTAL | 1,660 | 1,660 | 1,856 | 2,078 | 1,942 |
FY2016 Spending Category Chart
