|
FY2016 House 1 |
FY2016 House Final |
FY2016 Senate Final |
FY2016 GAA |
|
|---|---|---|---|---|
| Budget Tracking | 8,125,413 | 8,219,367 | 8,287,921 | 8,219,367 |
|
FY2013 GAA |
FY2014 GAA |
FY2015 GAA |
FY2015 Projected |
FY2016 GAA |
|
|---|---|---|---|---|---|
| Historical Budget Levels | 7,771,053 | 7,791,053 | 8,125,413 | 8,018,536 | 8,219,367 |
* GAA is General Appropriation Act.
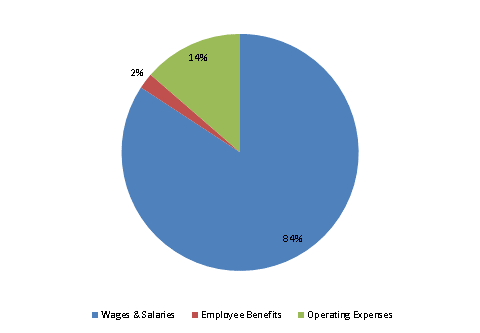
| SPENDING CATEGORY |
FY2012 Expended |
FY2013 Expended |
FY2014 Expended |
FY2015 Projected |
FY2016 GAA |
|---|---|---|---|---|---|
| Wages & Salaries | 6,310 | 6,572 | 6,901 | 6,244 | 6,923 |
| Employee Benefits | 146 | 140 | 128 | 157 | 175 |
| Operating Expenses | 945 | 1,060 | 962 | 708 | 1,120 |
| Grants & Subsidies | 0 | 0 | 0 | 909 | 0 |
| TOTAL | 7,401 | 7,771 | 7,991 | 8,019 | 8,219 |
FY2016 Spending Category Chart