|
FY2016 House 1 |
FY2016 House Final |
FY2016 Senate Final |
FY2016 GAA |
|
|---|---|---|---|---|
| Budget Tracking | 8,998,569 | 9,102,619 | 9,178,540 | 9,102,619 |
|
FY2013 GAA |
FY2014 GAA |
FY2015 GAA |
FY2015 Projected |
FY2016 GAA |
|
|---|---|---|---|---|---|
| Historical Budget Levels | 8,610,626 | 8,630,626 | 8,998,569 | 8,916,063 | 9,102,619 |
* GAA is General Appropriation Act.
| SPENDING CATEGORY |
FY2012 Expended |
FY2013 Expended |
FY2014 Expended |
FY2015 Projected |
FY2016 GAA |
|---|---|---|---|---|---|
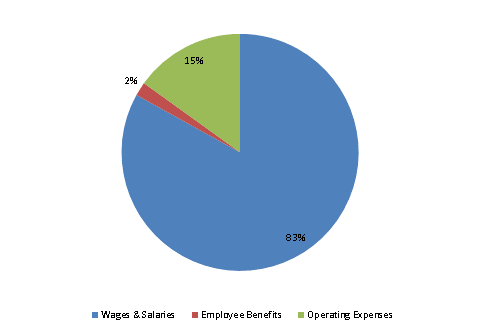
| Wages & Salaries | 6,389 | 6,692 | 7,050 | 7,167 | 7,560 |
| Employee Benefits | 152 | 116 | 134 | 141 | 171 |
| Operating Expenses | 1,773 | 1,803 | 1,446 | 1,609 | 1,372 |
| TOTAL | 8,314 | 8,611 | 8,630 | 8,916 | 9,103 |
FY2016 Spending Category Chart
