|
FY2016 House 1 |
FY2016 House Final |
FY2016 Senate Final |
FY2016 GAA |
|
|---|---|---|---|---|
| Budget Tracking | 3,461,031 | 3,881,275 | 3,881,275 | 3,881,275 |
|
FY2013 GAA |
FY2014 GAA |
FY2015 GAA |
FY2015 Projected |
FY2016 GAA |
|
|---|---|---|---|---|---|
| Historical Budget Levels | 2,973,811 | 3,444,002 | 3,478,442 | 3,472,141 | 3,881,275 |
* GAA is General Appropriation Act.
| SPENDING CATEGORY |
FY2012 Expended |
FY2013 Expended |
FY2014 Expended |
FY2015 Projected |
FY2016 GAA |
|---|---|---|---|---|---|
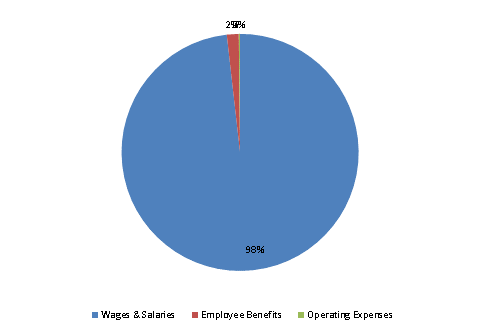
| Wages & Salaries | 706 | 3,110 | 3,450 | 3,411 | 3,812 |
| Employee Benefits | 14 | 40 | 49 | 51 | 63 |
| Operating Expenses | 4 | 4 | 4 | 10 | 7 |
| TOTAL | 724 | 3,155 | 3,503 | 3,472 | 3,881 |
FY2016 Spending Category Chart
