|
FY2016 House 1 |
FY2016 House Final |
FY2016 Senate Final |
FY2016 GAA |
|
|---|---|---|---|---|
| Budget Tracking | 214,812,830 | 227,379,650 | 237,070,698 | 235,637,941 |
|
FY2013 GAA |
FY2014 GAA |
FY2015 GAA |
FY2015 Projected |
FY2016 GAA |
|
|---|---|---|---|---|---|
| Historical Budget Levels | 217,180,156 | 218,967,364 | 219,523,472 | 217,712,419 | 235,637,941 |
* GAA is General Appropriation Act.
| SPENDING CATEGORY |
FY2012 Expended |
FY2013 Expended |
FY2014 Expended |
FY2015 Projected |
FY2016 GAA |
|---|---|---|---|---|---|
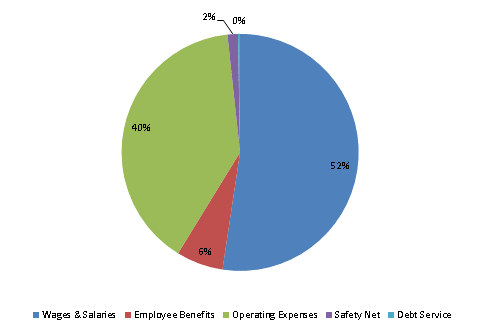
| Wages & Salaries | 105,037 | 110,932 | 114,022 | 120,098 | 123,427 |
| Employee Benefits | 13,505 | 13,356 | 14,267 | 13,880 | 15,039 |
| Operating Expenses | 80,533 | 80,684 | 81,449 | 80,186 | 93,162 |
| Safety Net | 3,090 | 2,985 | 3,046 | 2,977 | 3,352 |
| Debt Service | 71 | 242 | 657 | 571 | 657 |
| TOTAL | 202,236 | 208,199 | 213,441 | 217,712 | 235,638 |
FY2016 Spending Category Chart
