Quick Links
- Statewide Summary
- Judiciary
- Independents
- District Attorneys
- Sheriffs
- Governor's Office
- Secretary of State
- Treasurer
- State Auditor
- Attorney General
- State Ethics Commission
- Inspector General
- Campaign Finance
- Comm. Against Discrimination
- Status of Women
- Disabled Persons Protection
- Library Commissioners
- Comptroller
- Office of the Child Advocate
- Mass Gaming Commission
- Center for Health Info and Analysis
- Administration and Finance
- Energy & Environmental Affairs
- Health and Human Services
- Transportation
- Housing & Economic Development
- Labor & Workforce Development
- Education
- Public Safety
- Legislature
- All Account Listing
- Veto Listing
- Local Aid - Section 3
- Outside Sections
- Downloads
- Navigation Guide
- Budget Glossary
- Helpful Links
|
FY2016 House 1 |
FY2016 House Final |
FY2016 Senate Final |
FY2016 GAA |
|
|---|---|---|---|---|
| Budget Tracking | 100,000 | 125,000 | 435,000 | 435,000 |
|
FY2013 GAA |
FY2014 GAA |
FY2015 GAA |
FY2015 Projected |
FY2016 GAA |
|
|---|---|---|---|---|---|
| Historical Budget Levels | 85,000 | 100,000 | 160,000 | 157,144 | 435,000 |
* GAA is General Appropriation Act.
| SPENDING CATEGORY |
FY2012 Expended |
FY2013 Expended |
FY2014 Expended |
FY2015 Projected |
FY2016 GAA |
|---|---|---|---|---|---|
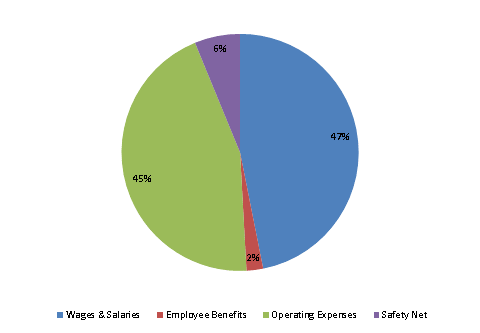
| Wages & Salaries | 36 | 51 | 58 | 72 | 204 |
| Employee Benefits | 1 | 2 | 2 | 5 | 10 |
| Operating Expenses | 44 | 23 | 33 | 81 | 194 |
| Safety Net | 0 | 0 | 0 | 0 | 27 |
| TOTAL | 82 | 76 | 94 | 157 | 435 |
FY2016 Spending Category Chart
