| SPENDING CATEGORY |
FY2011 Expended |
FY2012 Expended |
FY2013 Expended |
FY2014 Projected |
FY2015 GAA |
|---|---|---|---|---|---|
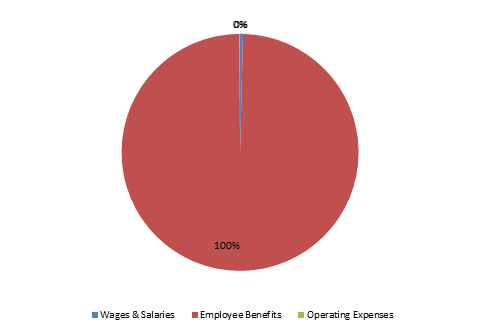
| Wages & Salaries | 4,448 | 4,798 | 5,095 | 6,827 | 7,389 |
| Employee Benefits | 1,265,568 | 1,614,931 | 1,687,585 | 1,819,353 | 1,876,549 |
| Operating Expenses | 257,370 | 827 | 842 | 1,361 | 1,523 |
| TOTAL | 1,527,386 | 1,620,556 | 1,693,523 | 1,827,541 | 1,885,461 |
FY2015 Spending Category Chart
