|
FY2015 House 1 |
FY2015 House Final |
FY2015 Senate Final |
FY2015 GAA |
|
|---|---|---|---|---|
| Budget Tracking | 16,213,523 | 16,162,178 | 16,573,523 | 16,342,178 |
|
FY2012 GAA |
FY2013 GAA |
FY2014 GAA |
FY2014 Projected |
FY2015 GAA |
|
|---|---|---|---|---|---|
| Historical Budget Levels | 21,602,546 | 18,500,869 | 15,969,821 | 16,988,821 | 16,342,178 |
* GAA is General Appropriation Act.
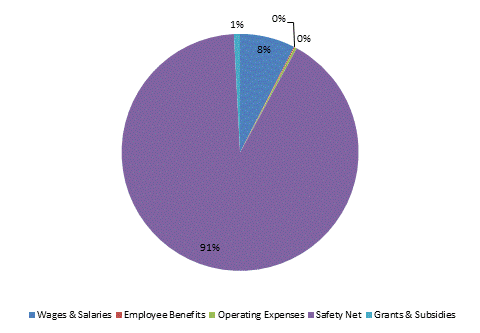
| SPENDING CATEGORY |
FY2011 Expended |
FY2012 Expended |
FY2013 Expended |
FY2014 Projected |
FY2015 GAA |
|---|---|---|---|---|---|
| Wages & Salaries | 1,319 | 1,277 | 1,235 | 1,295 | 1,228 |
| Employee Benefits | 22 | 24 | 18 | 20 | 20 |
| Operating Expenses | 53 | 56 | 49 | 49 | 50 |
| Safety Net | 26,262 | 18,239 | 16,563 | 15,400 | 14,908 |
| Grants & Subsidies | 0 | 0 | 0 | 225 | 136 |
| TOTAL | 27,657 | 19,596 | 17,866 | 16,989 | 16,342 |
FY2015 Spending Category Chart