|
FY2015 House 1 |
FY2015 House Final |
FY2015 Senate Final |
FY2015 GAA |
|
|---|---|---|---|---|
| Budget Tracking | 253,925,537 | 255,125,538 | 264,039,069 | 265,239,069 |
|
FY2012 GAA |
FY2013 GAA |
FY2014 GAA |
FY2014 Projected |
FY2015 GAA |
|
|---|---|---|---|---|---|
| Historical Budget Levels | 227,725,459 | 244,122,688 | 251,914,660 | 252,054,661 | 265,239,069 |
* GAA is General Appropriation Act.
| SPENDING CATEGORY |
FY2011 Expended |
FY2012 Expended |
FY2013 Expended |
FY2014 Projected |
FY2015 GAA |
|---|---|---|---|---|---|
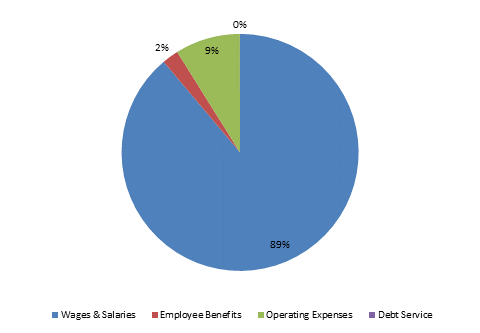
| Wages & Salaries | 205,316 | 211,198 | 218,667 | 220,615 | 235,645 |
| Employee Benefits | 6,694 | 6,230 | 5,086 | 5,969 | 5,978 |
| Operating Expenses | 19,731 | 19,243 | 21,583 | 25,233 | 23,519 |
| Safety Net | 10 | 0 | 0 | 0 | 0 |
| Grants & Subsidies | 0 | 0 | 0 | 140 | 0 |
| Debt Service | 0 | 13 | 97 | 97 | 97 |
| TOTAL | 231,751 | 236,685 | 245,433 | 252,055 | 265,239 |
FY2015 Spending Category Chart
