|
FY2015 House 1 |
FY2015 House Final |
FY2015 Senate Final |
FY2015 GAA |
|
|---|---|---|---|---|
| Budget Tracking | 22,508,930 | 22,508,930 | 22,508,931 | 22,508,930 |
|
FY2012 GAA |
FY2013 GAA |
FY2014 GAA |
FY2014 Projected |
FY2015 GAA |
|
|---|---|---|---|---|---|
| Historical Budget Levels | 17,803,749 | 18,467,861 | 19,250,607 | 22,462,968 | 22,508,930 |
* GAA is General Appropriation Act.
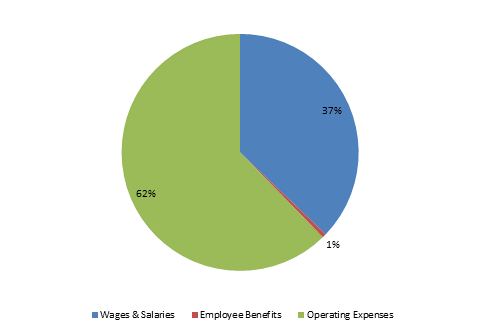
| SPENDING CATEGORY |
FY2011 Expended |
FY2012 Expended |
FY2013 Expended |
FY2014 Projected |
FY2015 GAA |
|---|---|---|---|---|---|
| Wages & Salaries | 6,254 | 6,528 | 6,829 | 5,969 | 8,363 |
| Employee Benefits | 126 | 134 | 98 | 90 | 124 |
| Operating Expenses | 11,508 | 12,266 | 13,059 | 16,204 | 14,022 |
| Safety Net | 0 | 0 | 0 | 200 | 0 |
| TOTAL | 17,888 | 18,928 | 19,987 | 22,463 | 22,509 |
FY2015 Spending Category Chart