|
FY2015 House 1 |
FY2015 House Final |
FY2015 Senate Final |
FY2015 GAA |
|
|---|---|---|---|---|
| Budget Tracking | 2,325,751 | 3,437,964 | 2,249,334 | 3,249,334 |
|
FY2012 GAA |
FY2013 GAA |
FY2014 GAA |
FY2014 Projected |
FY2015 GAA |
|
|---|---|---|---|---|---|
| Historical Budget Levels | 1,624,791 | 2,953,649 | 3,318,529 | 3,318,529 | 3,249,334 |
* GAA is General Appropriation Act.
| SPENDING CATEGORY |
FY2011 Expended |
FY2012 Expended |
FY2013 Expended |
FY2014 Projected |
FY2015 GAA |
|---|---|---|---|---|---|
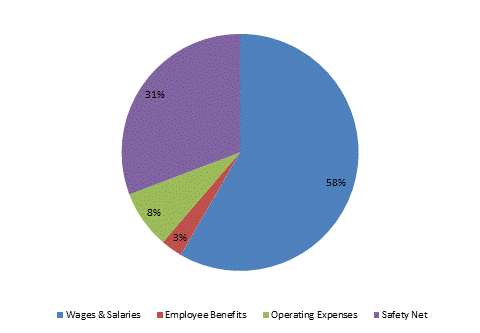
| Wages & Salaries | 1,517 | 1,520 | 1,756 | 2,137 | 1,896 |
| Employee Benefits | 45 | 46 | 45 | 69 | 96 |
| Operating Expenses | 64 | 53 | 145 | 103 | 258 |
| Safety Net | 0 | 0 | 500 | 1,000 | 1,000 |
| Grants & Subsidies | 0 | 0 | 0 | 10 | 0 |
| TOTAL | 1,626 | 1,619 | 2,446 | 3,319 | 3,249 |
FY2015 Spending Category Chart
