|
FY2015 House 1 |
FY2015 House Final |
FY2015 Senate Final |
FY2015 GAA |
|
|---|---|---|---|---|
| Budget Tracking | 7,706,297 | 8,006,297 | 7,793,523 | 8,256,297 |
|
FY2012 GAA |
FY2013 GAA |
FY2014 GAA |
FY2014 Projected |
FY2015 GAA |
|
|---|---|---|---|---|---|
| Historical Budget Levels | 6,740,746 | 7,667,618 | 7,890,268 | 7,804,728 | 8,256,297 |
* GAA is General Appropriation Act.
| SPENDING CATEGORY |
FY2011 Expended |
FY2012 Expended |
FY2013 Expended |
FY2014 Projected |
FY2015 GAA |
|---|---|---|---|---|---|
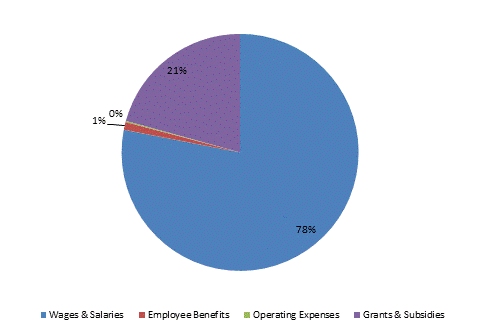
| Wages & Salaries | 6,375 | 4,583 | 6,284 | 5,871 | 6,445 |
| Employee Benefits | 65 | 81 | 71 | 82 | 88 |
| Operating Expenses | 22 | 44 | 21 | 13 | 14 |
| Grants & Subsidies | 961 | 1,180 | 1,661 | 1,839 | 1,709 |
| TOTAL | 7,423 | 5,889 | 8,037 | 7,805 | 8,256 |
FY2015 Spending Category Chart
